National Joint Registry Outcome Data
Submitting data to the National Joint Registry is mandatory for surgeons in England, Wales, Northern Ireland, the Isle of Man, and the Channel Islands. It allows surgeon and implant performance to be monitored. Surgeons can access their own outcomes data and my charts are displayed here.
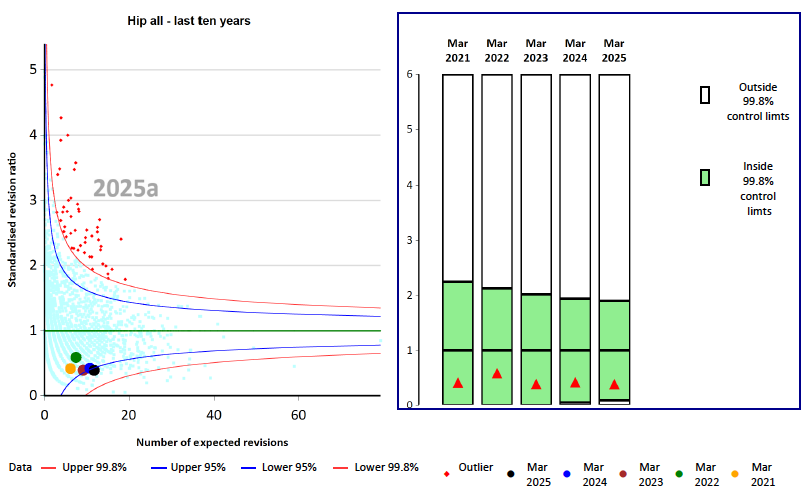
My latest funnel chart shows my revision (redo) rate for the last 10 years,. the black dot is my latest data and is below the 95% line, indicating a significantly lower than expected revision rate for my patients. My latest 1, 5 and 10 year revision rates are 0.23%, 0.56% and 1.37% respectively compared to the national averages of 0.88%, 2.02% and 3.58%.
Patient Reported Outcome Measures (PROMs)
Beyond revision rates, data on how patients feel about their health and outcomes of the surgery are collected. One such measure is known as the Oxford Hip Score. It asks questions on pain and function and is useful to measure how patients are before and after surgery. You can download the questionnaire here.
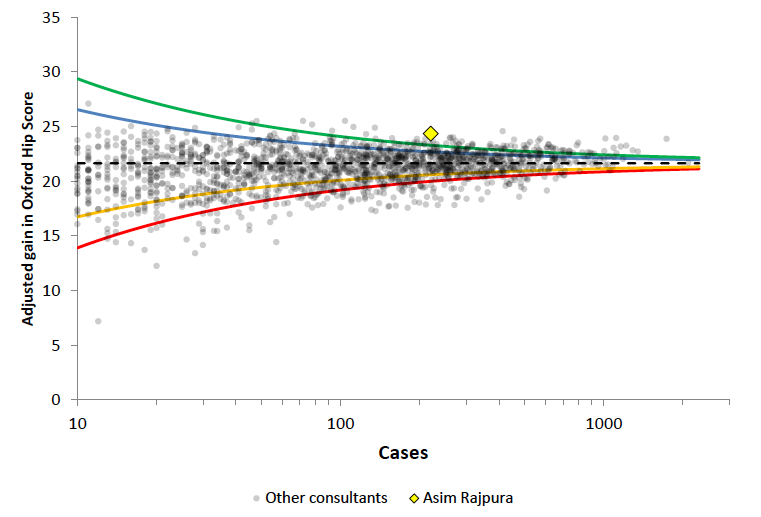
This funnel plot shows the improvement in this score from pre to post operative. The average gain for my patients is above the green line which is 3 standard deviations above the average change. This puts us in the top 1% nationally.
Overall success and satisfaction rates
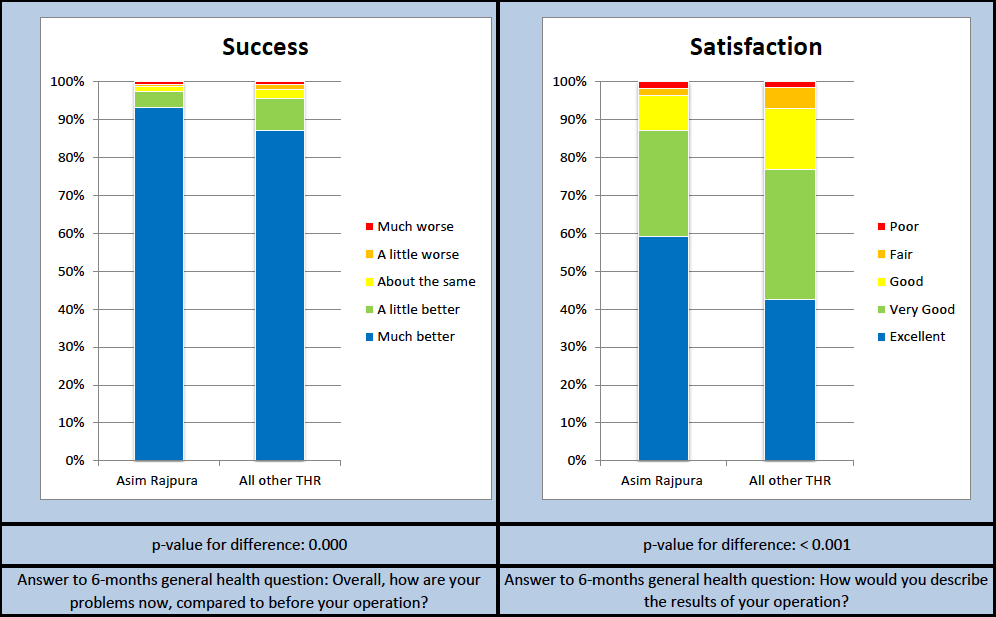
These bar charts shows overall patient reported satisfaction and success rates after hip replacement, comparing my outcomes to the national average. Both show statistically significantly better outcomes for our patients than the national average. Satisfaction rate is 97.4% (good, very good or excellent) and success rate is 97.3%.
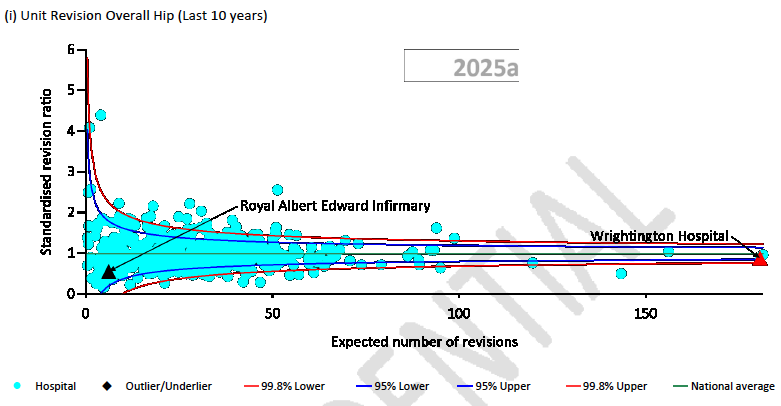
Hospital Level Outcomes
Beyond choosing your surgeon, it is important to consider the hospital as a whole. At Wrightington we pride ourselves on the quality of our work and this is demonstrated in our low revision rates as well as our high volume.